When working with data in Excel, you may want to know if two groups are significantly different. For example:
-
Do students who study more hours score higher on average?
-
Do two marketing campaigns produce different results?
The T.TEST function in Excel helps answer these questions. It performs a Student’s t-test, a common statistical test for comparing means between two samples.
🔍 What is the T.TEST Function?
The T.TEST function returns the probability (p-value) that the means of two datasets are not significantly different.
Syntax:
-
array1 → First dataset.
-
array2 → Second dataset.
-
tails → Number of distribution tails:
-
1 = One-tailed test
-
2 = Two-tailed test
-
-
type → Type of t-test:
-
1 = Paired test
-
2 = Two-sample equal variance (homoscedastic)
-
3 = Two-sample unequal variance (heteroscedastic)
-
💡 Note: T.TEST returns a p-value. A common threshold is 0.05 (5%).
-
If p ≤ 0.05 → The difference is statistically significant.
-
If p > 0.05 → No significant difference.
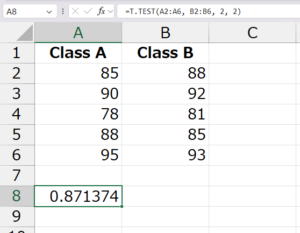
✅ Example 1: Comparing Test Scores (Two-Tailed Test)
You have test scores from two classes:
| Class A | Class B |
|---|---|
| 85 | 88 |
| 90 | 92 |
| 78 | 81 |
| 88 | 85 |
| 95 | 93 |
Formula:
Result: 0.871374 (example)
✔️ Explanation: Since p = 0.871 > 0.05, the difference in averages between the two classes is not statistically significant.
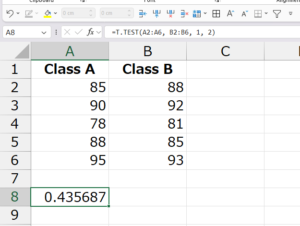
✅ Example 2: One-Tailed Test
If you want to check whether Class B scores are significantly higher than Class A:
Formula:
✔️ Explanation: A one-tailed test checks if one group is greater than the other, not just different.
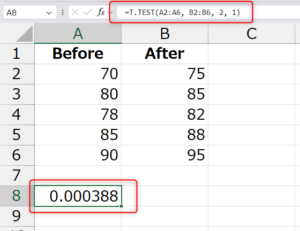
✅ Example 3: Paired T-Test
You test the same students before and after a training program:
| Before | After |
|---|---|
| 70 | 75 |
| 80 | 85 |
| 78 | 82 |
| 85 | 88 |
| 90 | 95 |
Formula:
✔️ Explanation: Type = 1 means paired test.
If p ≤ 0.05, the training program had a significant effect.
🎯 Practical Uses of T.TEST
-
Education → Compare student performance across groups.
-
Business & Marketing → Evaluate A/B test results (e.g., two ads).
-
Medical Research → Compare patient outcomes before and after treatment.
-
Finance → Compare returns of two investment strategies.
📝 Conclusion
The T.TEST function in Excel is a powerful statistical tool for hypothesis testing. By calculating the p-value, it helps you determine whether two groups are significantly different.
👉 Use T.TEST when analyzing experiments, business data, or research results to make data-driven decisions.